Attention: For research and education purposes only, absolutely not an investment advice. You are solely responsible for your investment decisions. All the charts presented here are produced by MultiCharts64.
At times, I present a series of bar charts to share my technical analysis approach with you. Here are the charts of the HKSE stock scanner result UP list as at 20140120. From them, you’ll see some similar patterns of why the stock scanner digs them out. First of all, let’s have a look at them and I’ll briefly comment one by one. As a matter of fact, my comments here are not comprehensive, the algorithms of the stock scanner is a combination of a few mutually exclusive criteria. But at last I always read the chart to conclude the recommendations using visual methods such as Wyckoff principles, which is what I have not done on a daily basis. So here is the caveat: the stock scanner results posted have not been gone through my visual confirmation.
0198.HK
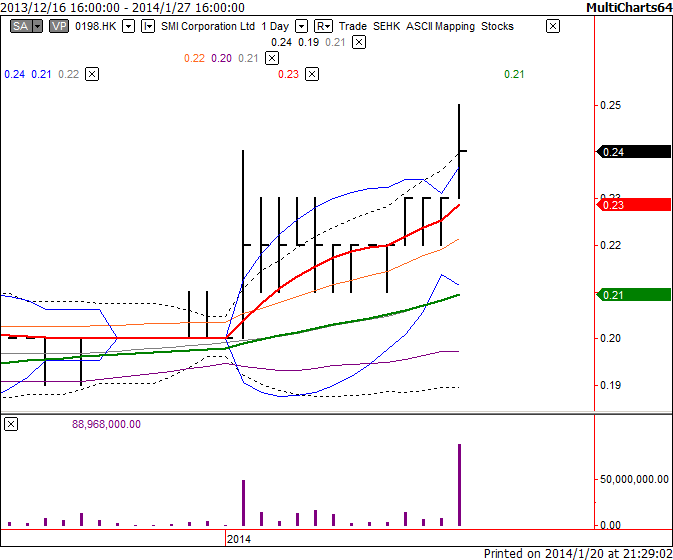
0198.HK-20140120
Characteristics: Moving averages (MA) are up, close outside Upper Bollinger Bands (UBB) with a recent squeeze, a recent breakup with comparatively great volume. Better to have the next day confirmation as the close is in the middle of the bar.
0518.HK

0518.HK-201401201
Characteristics: Moving averages (MA) are up, close outside Upper Bollinger Bands (UBB) with a recent squeeze, a recent breakup with great volume. The close seems a bit weaker, better to have the next day confirmation.
0640.HK
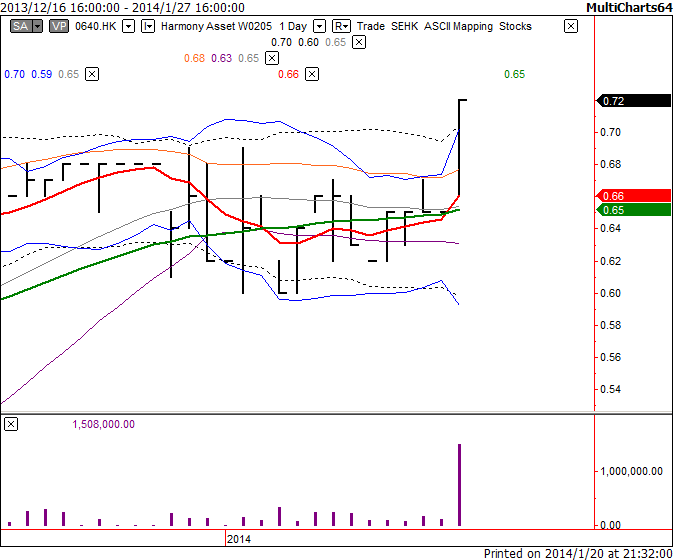
0640.HK-2014012011
Characteristics: Moving averages (MA) are up, close outside Upper Bollinger Bands (UBB) with a recent squeeze, a recent breakup with great volume. Strong close with increasing volume, but the volume may be too far away as a warning sign.
0862.HK

0862.HK-20140120111
Characteristics: Moving averages (MA) are up but no golden cross yet, close outside Upper Bollinger Bands (UBB) with a recent squeeze, a recent breakup with comparatively great volume. Close above mid-point with comparatively high volume.
1059.HK
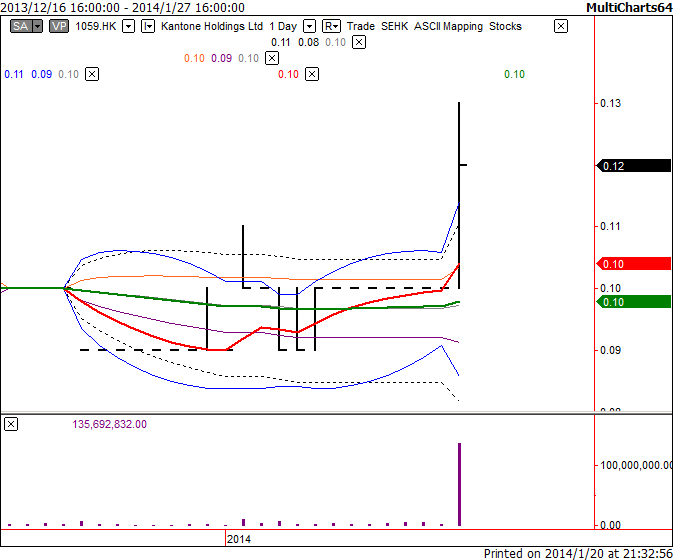
1059.HK-201401201111
Characteristics: Moving averages (MA) are up, close outside Upper Bollinger Bands (UBB) with a recent squeeze, a recent breakup with great volume. Strong close with increasing volume, but the volume may be too far away as a warning sign.
2382.HK

2382.HK-2014012011111
Characteristics: Probably on the course of an uptrend, MA are up, close outside UBB with a recent squeeze, a recent breakup with comparatively high volume. Strong close with increasing volume.
Sounds logical? What do you think about them? Anyway we never know what will happen tomorrow or in the future (at least I think it’s true in the financial markets), each one of them may go up or down or stand still. To be a consistent winning trader, one has to have a good trading system (no matter what) and follow it consistently, prudently.
Finally, you should have found that I did not use Ichimoku Kinko Hyo, right? I’ll open another post to write something about it. Stay tuned.
Happy trading!